Hello readers! The season is now underway, and I have made a lot of improvements to my site. I list all of them in my What’s New post, and I’ll likely do deep dives on more of them in the future, but for now I want to focus on the new MLBR standings tracker.
This tool performs my MLBR (Machine Learning Battle Royale) evaluations across historical data as far back as the 2007–08 season (which was the earliest season Torvik has data for). Once again, huge shoutout to Bart Torvik for maintaining such a robust historical dataset on his website (barttorvik.com), and making it available for free. None of this would be possible without his data.
Before we start, I’m going to give a brief refresher on the models and how they are evaluated. If you’re a returning reader who already feels confident in your knowledge of the models and evaluation metrics, feel free to click here to jump ahead. Conversely, if you want more detail on how each model and metric works, I recommend you check out my 2025 MLBR article, or the new glossary, which explains every model and metric on the site.
To recap: I code a bunch of different machine learning models on each season’s data leading up to Selection Sunday to make predictions about the March Madness tournament, then I evaluate them and compare them to alternative methods and established predictive models using a host of evaluation metrics.
Those models are:
- Resumetric — This is a “true” resume metric. It evaluates teams based solely on who they’ve beaten, where they beat them, and who those teams have beaten. It does not account for things like margin of victory when assessing team strength.*
- Minnow — Minnow operates much the same way that advanced predictive models, such as KenPom and Torvik, do.
- Branchy Brackets — A tree algorithm that is trained on a lot of factors, including the advanced efficiency metrics produced by Minnow, in the hopes of discovering relationships between specific data points to arrive at advanced insights.
- The Composite — An average of the three other methods.
* This separates it from other resume metrics like strength of record or wins above bubble, since those metrics still evaluate the quality of the win based on advanced efficiency metrics, which typically account for margin of victory.
We compare those models to the “chalk” method (always picking the higher seed) and Torvik, a well-respected advanced analytics model coded by Bart Torvik, available at barttorvik.com.
I evaluate these models using the following metrics:
- Accuracy — For what percentage of tournament matchups did the model correctly predict the winner?
- Tournament Points — If the models all filled out a bracket before the tournament started, how many points would they earn using the traditional bracket scoring system (i.e., 10 points for a correct pick in the first round, 20 for a correct pick in the second round, 40 for a correct pick in the Sweet 16, 80 for a correct pick in the Elite Eight, and so on)?
- Expected Tourney Points — The average number of bracket points a simulation generated by this model would earn.
- Log Loss — This one is a bit mathematically complicated. For a more thorough explanation, read my earlier post, but essentially, log loss rewards not only correctness but also accurate probabilities. It severely penalizes confidently wrong answers, encouraging models to not only predict correctly, but also predict with the right amount of confidence. This is the industry-standard metric for probabilistic outcome predictions. Since log loss is a penalty function, lower is better.
Now that we’ve gotten that out of the way, let’s look at the chart.
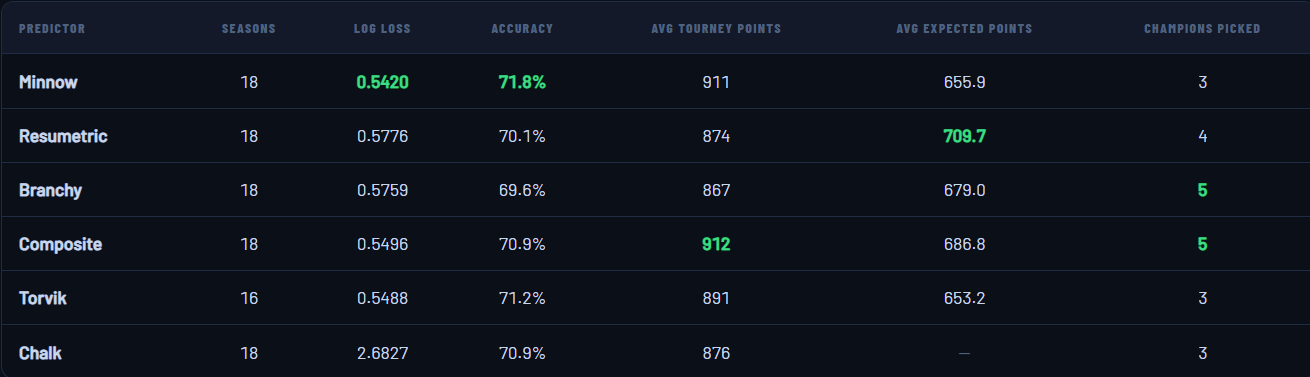
The first thing I want to address is Torvik. Turns out, I was giving his model an unfair advantage.
When I conducted previous MLBRs, I was using Torvik’s pregame win probabilities, which came from his super schedule data on his website. At the time, I assumed that the pregame win probability was a number that was calculated by his model with all of the info available to it leading up to that game. I knew that this would give his model a slight boost relative to mine, since when performing MLBR analysis, I judged my models based on what their predictions would have said on Selection Sunday, meaning they didn’t get to retrain between rounds. However, some analysis revealed that those win probabilities were not only using data gathered between rounds, but also were using Torvik’s final ratings from the season, which essentially meant that his model had the answer key before it took the test, since those ratings were trained on the games the win percentage was predicting.
Luckily, Torvik keeps a historical archive of what his rankings looked like at any given moment in time going back to the 2009–10 season at https://barttorvik.com/trank-time-machine.php. Furthermore, Torvik explains on his blog how he calculates win probabilities from his Barthag ratings. With those two elements, we can calculate Torvik’s predicted win probabilities between any two teams at any given moment in time. This also means that we can calculate evaluation metrics for Torvik like Expected Tourney Points, which was previously impossible since it required us to generate a Torvik win probability for matchups that never occurred.
It is worth noting that this switch does now theoretically overcorrect the scales slightly. While Torvik’s model no longer gets to train on the games that it is predicting, removing a huge advantage, freezing Torvik’s model in time could put it at a disadvantage to my models. Over time, Torvik has certainly evolved his methods of calculation and prediction, and adjusted things like metavariable calculation based on what occurred as the seasons went on, and has been able to improve his models with optimizations along the way. By grabbing his ratings from a moment in time, we are denying his model those optimizations and metadata training. My models, while not gaining the benefit of training directly on the games they are being judged on, do get a larger sample size of past seasons when performing things like choosing metavariables, since my models have only been around for a couple of years at this point and we are projecting backward to what they would have said had they been around at the time.
Essentially, my models theoretically could benefit from slight adjustments (which is also why some of the scores may look a bit different from what you see in prior MLBRs) while Torvik’s model doesn’t get adjustments since it is truly frozen in time. Though, in reality, that advantage is likely purely theoretical, as the adjustments I’ve been making have been of the bug fixing variety more so than the optimization variety, but the potential for improvement nonetheless remains. That means that his model may be playing at a slight disadvantage now, rather than a slight advantage, so just keep that in mind as I walk through the rest of these numbers.
That aside, at first glance, the model with the best overall performance is Minnow. It holds narrow but meaningful (given the sample size) leads in Log Loss and Accuracy, and trails the leader in Average Tourney Points by only a single point.
However, there is one final caveat to consider.
While Torvik’s data goes back to the 2007–08 season, his time machine data only stretches back to 2009–10. That means that while I can reconstruct what my models’ ratings would have been for the 2008 and 2009 tournaments, we don’t have Torvik’s exact ratings from the time.
Minnow performed quite well in those tournaments, with the 2008 tournament representing perhaps its best year on record, coming in with a score of 0.4734 in Log Loss, 81% in Accuracy, and a staggering MLBR record of 1,640 Tournament Points.
Seeing as the 2008 tournament was relatively chalky (Steph Curry’s epic run with 10-seed Davidson aside, all four 1-seeds made the Final Four), it’s not hard to imagine Torvik having similar success in that tournament.
While I want to keep all 18 seasons on the live page, since every data point helps when comparing my models with each other, to fairly compare them to Torvik, we should cut out the two seasons where Torvik is not being scored.
That modified chart looks like this:
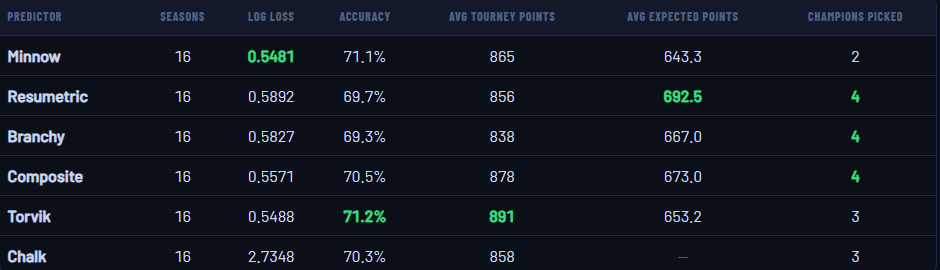
This puts Torvik a hair ahead of Minnow in Accuracy, and a hair behind in Log Loss. The margins in both categories are too narrow under this new analysis to meaningfully separate Torvik from Minnow, given the sample size, so I think it’s fair to say that they are performing comparably over our dataset.
It might be fair to give the slight nod to Torvik, given the caveats we discussed above, but it’s far from a given. What’s clear is that my model is competitive with Torvik, which is an outcome far beyond my expectations when I started this project.
Torvik and Minnow are also in a tier of their own when it comes to the two metrics we care most about: Log Loss and Accuracy. In either version of the results, there’s a sizable gap between those two models and the rest of the field.
This makes sense when you think about it. Torvik is an established and well-respected model designed by a professional, and Minnow is the model that most closely mimics Torvik’s design.
The Composite comes out narrowly ahead in Average Tourney Points. While this metric is a fun way to assess which model would most regularly win in a bracket pool,1 because of the way point totals are assigned, it swings wildly on key outcomes, and can’t really be trusted with this sample size as a result. For example, getting the champion, championship matchup, and Final Four right takes on outsized importance, which is true to how brackets work, but isn’t necessarily a reflection of true model quality.
Logically speaking, there isn’t a real reason why the Composite should be performing better than any of the other models in this category, as its founding principle is a rather unscientific “let’s mash the models together.” Looking at past results, we can see that the Composite does rely on a couple of outlier performances to boost itself to the top spot (namely 2009 with 1,400 and 2025 with 1,540), though, to be fair, the other models have outlier seasons as well (as mentioned earlier, Minnow has the MLBR single-season Tourney Points high score with 1,640 in 2008). Regardless, the lead there is very narrow, and I don’t expect it to hold up as we add more seasons in the years to come. I’d be fascinated to see the Composite prove me wrong, though.
Resumetric solidly leads in Expected Tourney Points. The reason for this is simple: Resumetric is the most confident in its picks of any of the models scored by this metric. Being confident in the favorites means that the average simulation using Resumetric odds puts the favorites into deeper rounds more frequently, and, as favorites tend to win more often than not, a larger share of those points gets fed to Resumetric.
Now, confident doesn’t mean well-calibrated. As the Log Loss scores show, Resumetric performs the worst of any of the non-Chalk models in the metric that punishes overconfidence. As an extreme example, Chalk technically makes its picks with something approaching 100% confidence, meaning its Average Tournament Points score essentially is its Expected Tournament Points score (which is why I don’t include it in the table, since it’d be redundant). A score of 876 Expected Tournament Points would lap the field, but there are real consequences to Chalk’s Log Loss score, reflecting that extreme confidence is rarely warranted if the goal is to provide an accurate probabilistic prediction.
I toyed with the idea of altering Resumetric’s probability math a bit to optimize its Log Loss score, but I ultimately decided to leave its calculations as is. The point of this project isn’t to optimize every model, it’s to see what different types of models do with the data and to see if we can learn anything from their patterns or differences. Tamping down Resumetric’s confidence just made it stand out less from the group. Cramped its style, so to speak. I think we gain something by having a simpler, but more confident model in the group. Besides, who knows? Resumetric has actually finished first in Log Loss in two of the last three tournaments, so perhaps in this new NIL era, it serves our models well to be more confident in favorites.
I want to close this article by giving some shine to the one model we really haven’t talked about at all so far: Branchy.
Ever the weirdo of our model family, Branchy ends up a slight last in Average Tourney Points and a comfortable last in Accuracy, yet somehow ties the Composite for the lead with five correct champions picked.
That’s not the most prestigious honor Branchy has to its name, though. That would be the only recorded MLBR sweep, winning all four evaluation categories, plus picking the correct champion, in the 2018 tournament. It’s only fitting that one of the wildest tournaments of all time, dominated by lovable weirdos like UMBC and Loyola-Chicago, was dominated in turn by our lovable weirdo model.
Footnotes
-
If we’re just scoring Tourney Points champions (with ties counting as a win for each tying model), it’s Chalk with 5 victories, then Torvik with 4, the Composite and Branchy with 3 apiece, Minnow with 2, and Resumetric with 1. Minnow also won 2008 and the Composite won 2009, the two seasons we don’t track Torvik for, which would bring them to 3 and 4. It is interesting to see that Chalk would win a hypothetical model bracket pool the most times out of any of the models when its average is fourth out of six. But it logically tracks: while sticking to chalk won’t be as flashy as deviating from it, and typically won’t get you as many high scores, it will reliably get you a fairly high tournament score. In that sense, Chalk provides a high floor, with a lower ceiling. ↩